1.4.3. Performance and Usage Diagnosis enabler
1.4.3.1. Introduction
Performance and Usage Diagnosis (PUD) enabler aims at collecting performance metrics from monitored targets by scraping metrics HTTP endpoints on them and highlighting potential problems in the ASSIST-IoT platform, so that it could autonomously act in accordance or to notify to the platform administrator to fine tuning machine resources. For this purpose we use Prometheus, an open-source software that collects metrics from targets by “scraping” metrics HTTP endpoints. Supported “targets” include kube-state-metrics for monitoring every kubernetes cluster used in the project, node-exporter metrics for monitoring hardware, OS metrics exposed by *NIX kernels, as well as other important metrics for the rest of the enablers used in the architecture. Together with its companion Alertmanager service, Prometheus is a flexible metrics collection and alerting tool.
1.4.3.2. Features
1.4.3.2.1. Performance and Usage Diagnosis (PUD) enabler’s features
Prometheus is an open-source monitoring framework. It provides out-of-the-box monitoring capabilities for the Kubernetes container orchestration platform. Its main features are:
Metric Collection: Prometheus uses the pull model to retrieve metrics over HTTP. There is an option to push metrics to Prometheus using Pushgateway for use cases where Prometheus cannot Scrape the metrics.
Metric Endpoint: The systems that you want to monitor using Prometheus should expose the metrics on an /metrics endpoint. Prometheus uses this endpoint to pull the metrics in regular intervals.
PromQL: Prometheus comes with PromQL, a very flexible query language that can be used to query the metrics in the Prometheus dashboard. Also, the PromQL query will be used by Prometheus UI and Grafana to visualize metrics.
Prometheus Exporters: Exporters are libraries which converts existing metric from third-party apps to Prometheus metrics format. There are many official and community Prometheus exporters. One example is, Kube State metrics, a service which talks to Kubernetes API server to get all the details about all the API objects like deployments, pods, daemonsets etc.
TSDB (time-series database): Prometheus uses TSDB for storing all the data. By default, all the data gets stored locally. However, there are options to integrate remote storage for Prometheus TSDB.
Alertmanager handles alerts sent by client applications such as the Prometheus server. It takes care of deduplicating, grouping, and routing them to the correct receiver integration.
Prometheus-es-adapter is a read and write adapter for integrading LTSE’s elastic search as prometheus’ persistent storage.
Grafana is a multi-platform open source analytics and interactive visualization web application. It’s used for creating and visualizing dashboads with graphs generated by prometheus metrics for more user friendly monitoring experience.
Kube state metrics is a listening service that generates metrics about the state of Kubernetes objects through leveraging the Kubernetes API.
Node_exporter is a Prometheus exporter for hardware and OS metrics exposed by *NIX kernels, written in Go is installed seperately in every GWEN and Ubuntu device. The node_exporter is designed to monitor the host system and it requires access to the host system so it’s not recommended to get deployed as a Docker container.
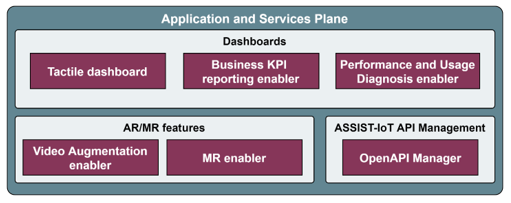
1.4.3.3. Place in architecture
Performance and Usage Diagnosis (PUD) enabler is located in the Application and Service layer of the ASSIST-IoT architecture that provides application logic, including data visualisation and user interaction services, data analytics capabilities, various kinds of data protection support, and data management logic. The PUD enabler is responsible to collect performance metrics from monitored targets.
Here is the high-level architecture of PUD’s Prometheus.
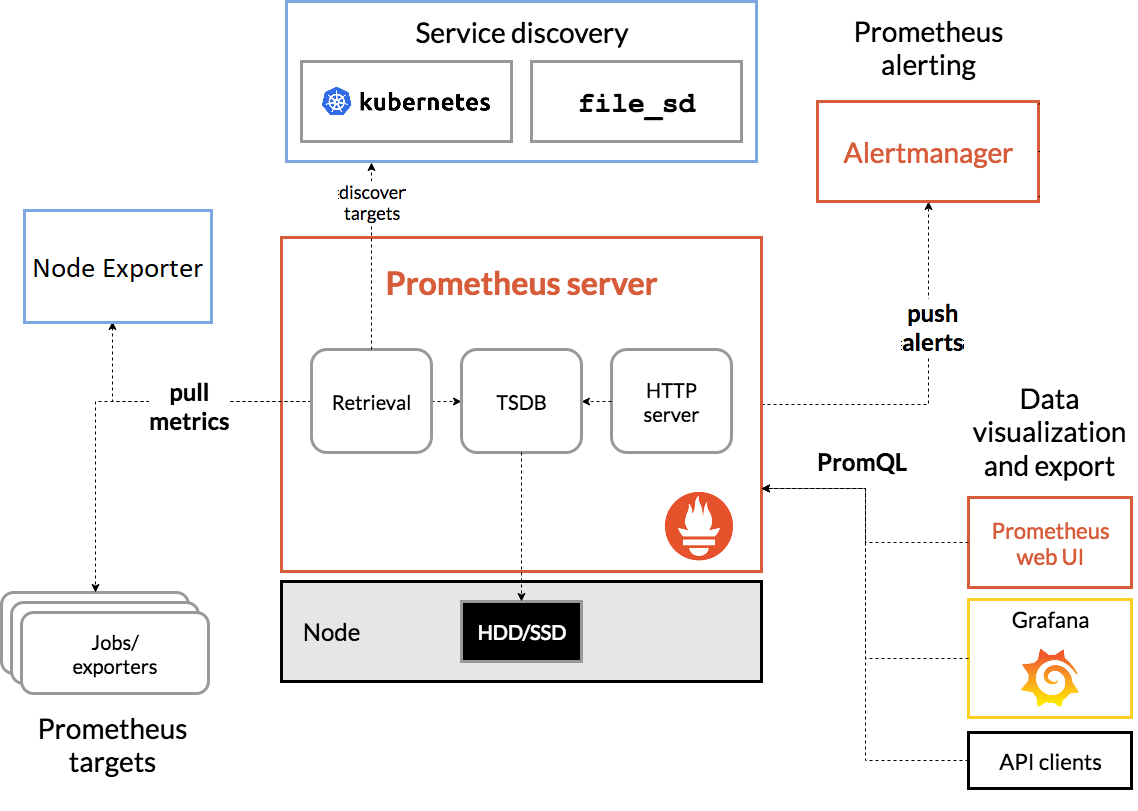
Prometheus scrapes metrics from instrumented jobs. It stores all scraped samples locally and runs rules over this data to either aggregate and record new time series from existing data or generate alerts.
Prometheus works well for recording any purely numeric time series. It fits both machine-centric monitoring as well as monitoring of highly dynamic service-oriented architectures. In a world of microservices, its support for multi-dimensional data collection and querying is a particular strength.
Prometheus is designed for reliability, to be the system you go to during an outage to allow you to quickly diagnose problems. Each Prometheus server is standalone, not depending on network storage or other remote services. You can rely on it when other parts of your infrastructure are broken, and you do not need to setup extensive infrastructure to use it.
1.4.3.4. User guide
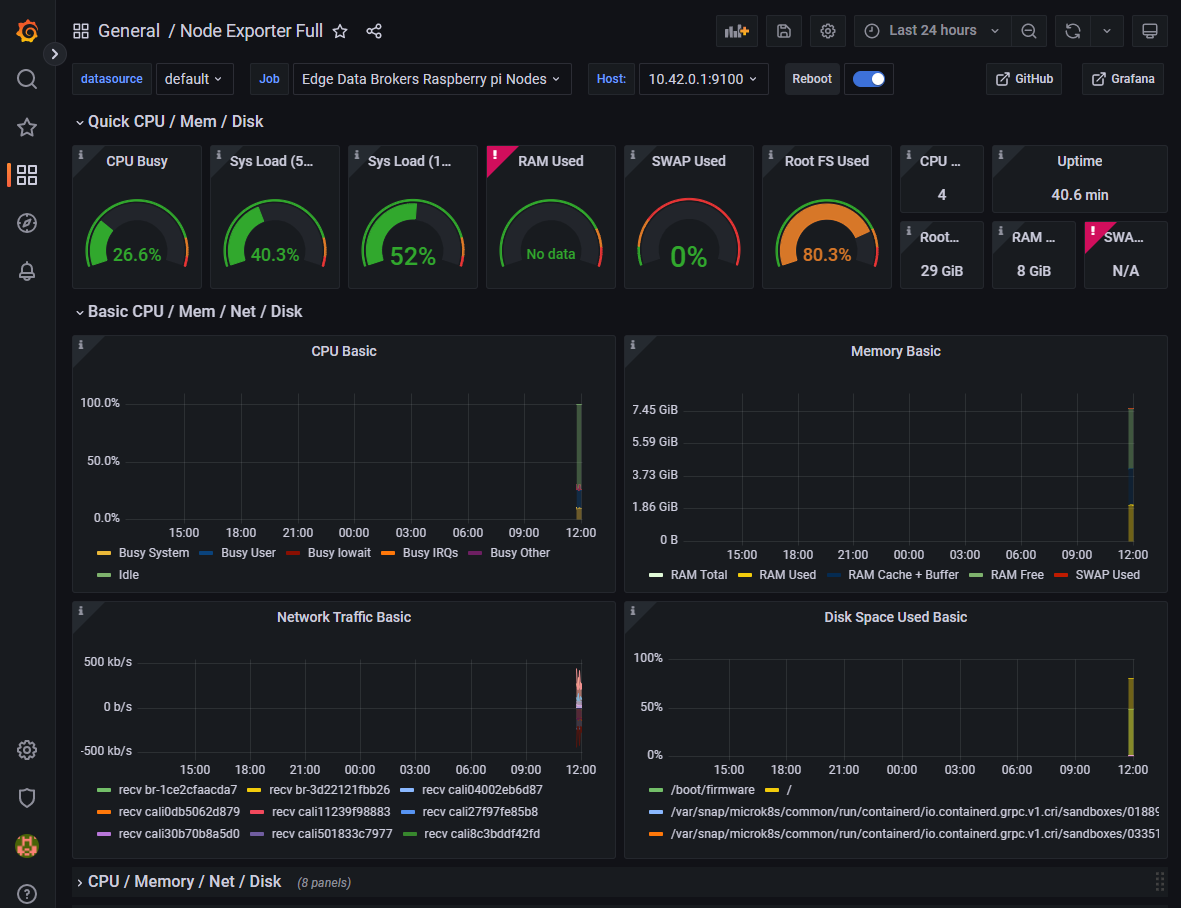
Prometheus provides a web UI for running basic queries located at http://<your_server_IP>:9090/. This is how it looks like in a web browser:
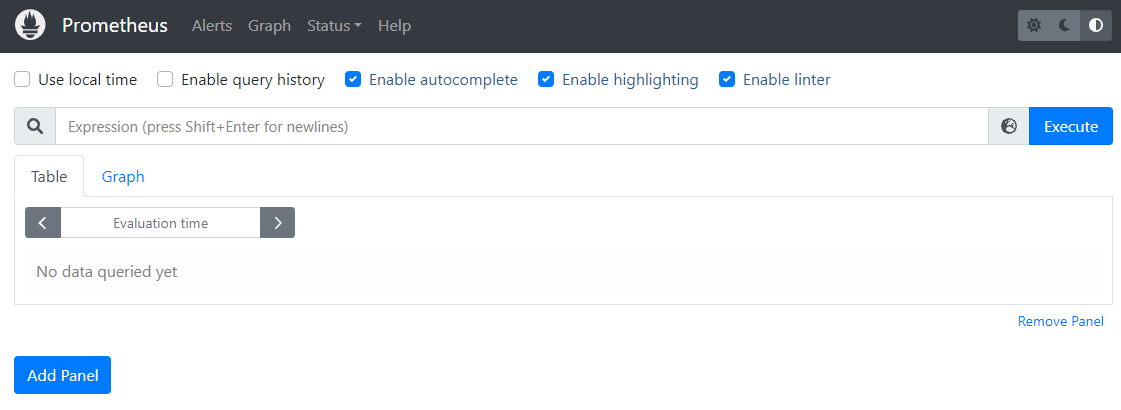
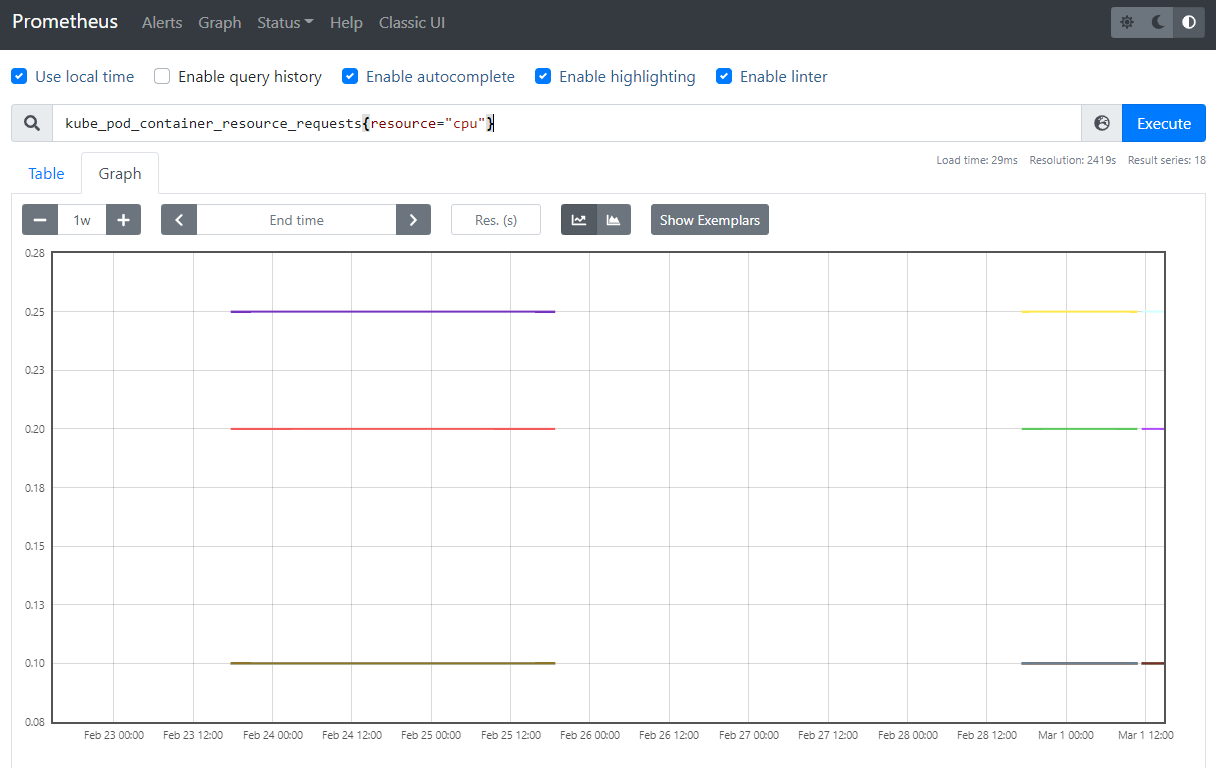
The “Table” tab is used to view the results of a query, while the “Graph” tab is used to create graphs based on a query.
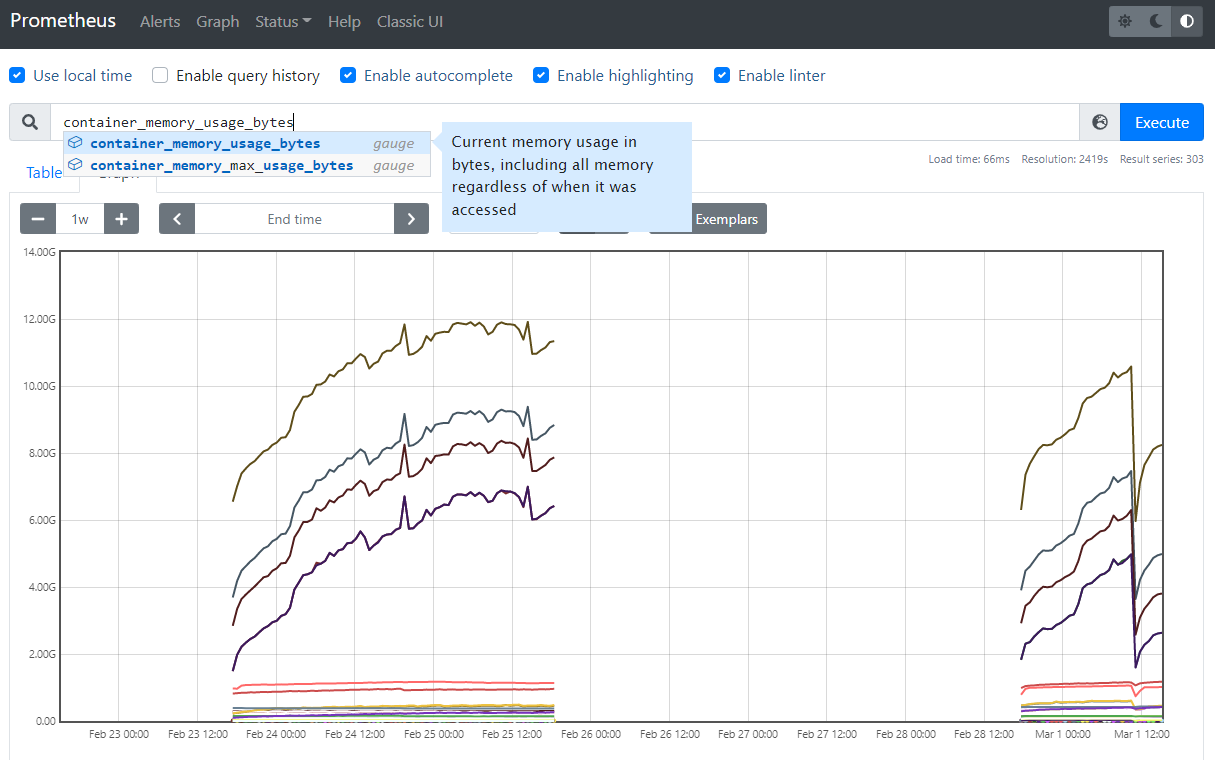
If you want to see a list of metrics sources, go to the Status > Targets page. Here, you will find a list of all services that are being monitored, including the path at which the metrics are available. In this case, the default path /metrics is used.
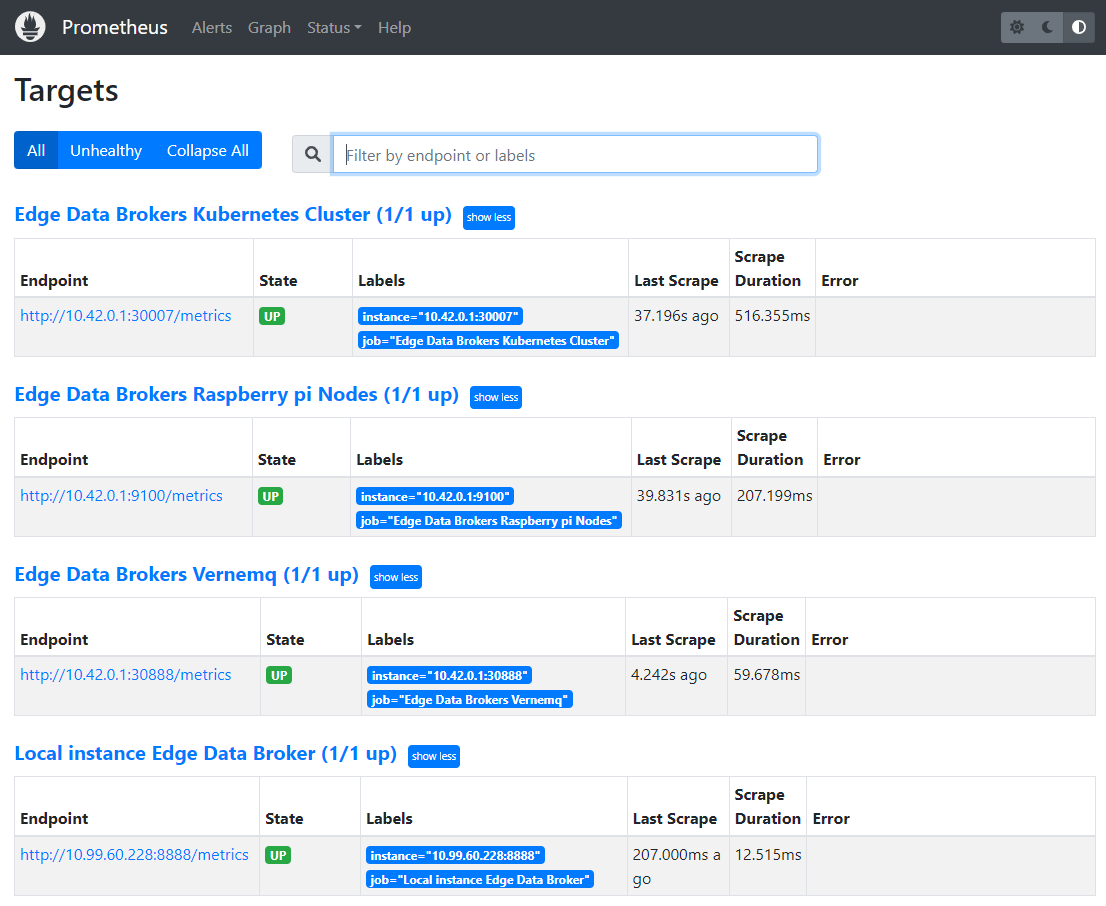
If you’re curious to see how the metrics page looks like, head over to one of them by clicking one of the endpoint URLs.
The Prometheus server collects metrics and stores them in a time series database. Individual metrics are identified with names such as kube_pod_container_resource_requests. A metric may have a number of “labels” attached to it, to distinguish it from other similar sources of metrics. As an example, suppose kube_pod_container_resource_requests refers to the number of requested request resource by a container. It may have a label such as resource, which helps you inspect individual system resources by mentioning them.
In PromQL, an expression or subexpression should always evaluate to one of the following data types:
Instant vector — It represents a time-varying value at a specific point of time.
Range vector — it represents a time-varying value, over a period of time.
Scalar — A simple numeric floating point value.
String — A string value. String literals can be enclosed between single quotes, double quotes or backticks (`). However, escape sequences like n are only processed when double quotes are used.
For more about Querying please refer to Prometheus’ documentation to get started.
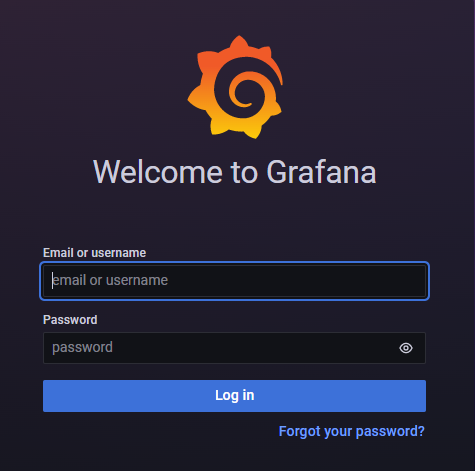
Grafana also provides a web UI located at http://<your_server_IP>:3000/. First the user needs to get logged in:
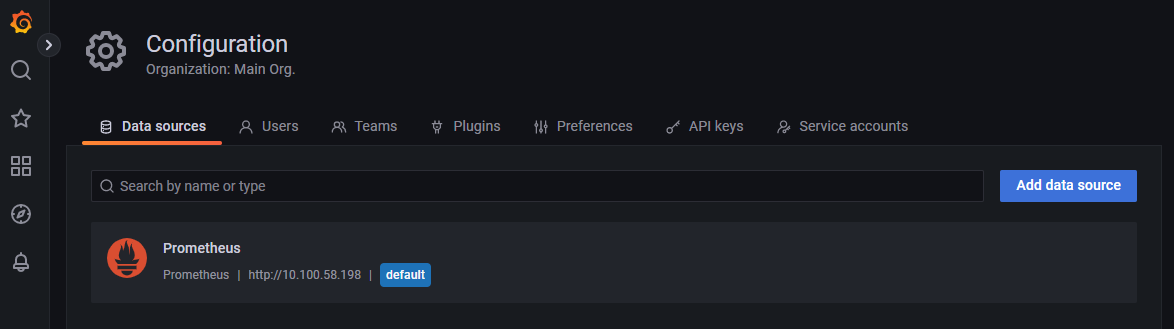
After login user should choose and add Prometheus data sourse in PUD’s Grafana.
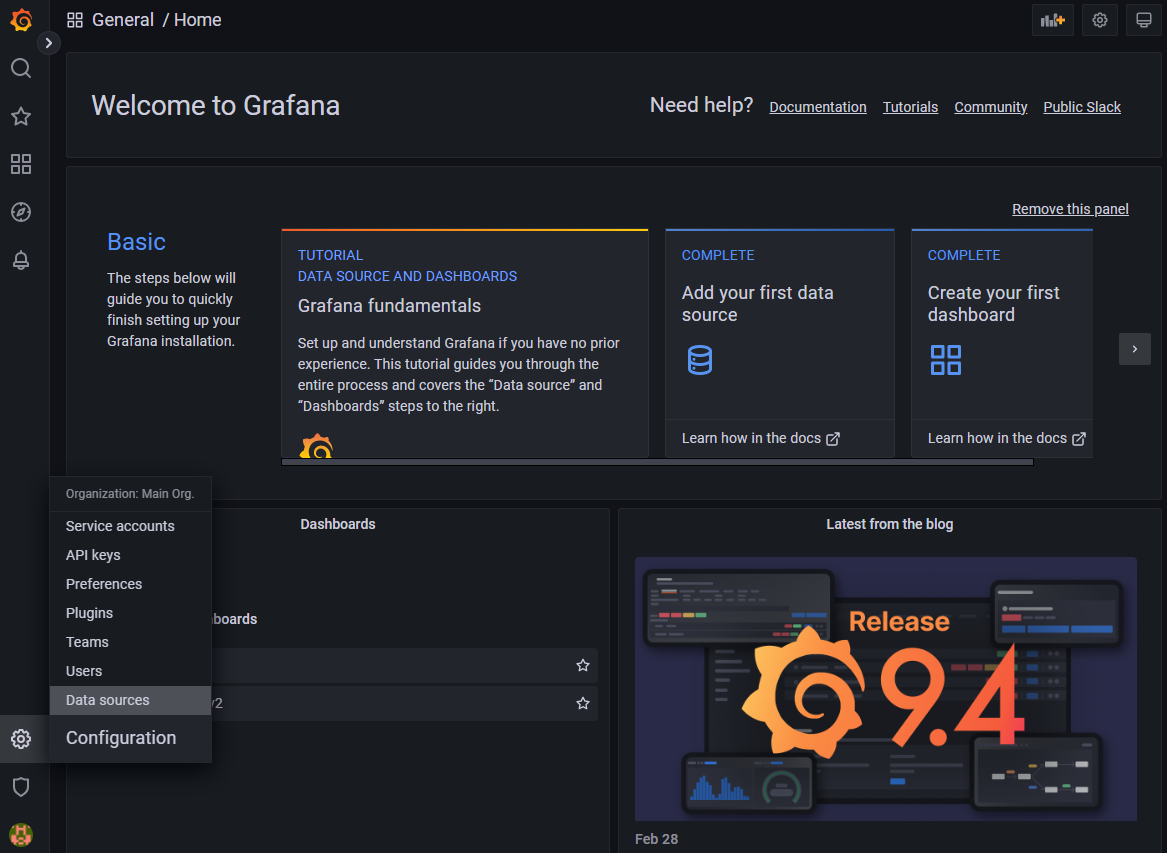
By going to Settings > Add Data Source > Prometheus.
After choosing data source user should import new Dashboards for PUD’s Grafana.
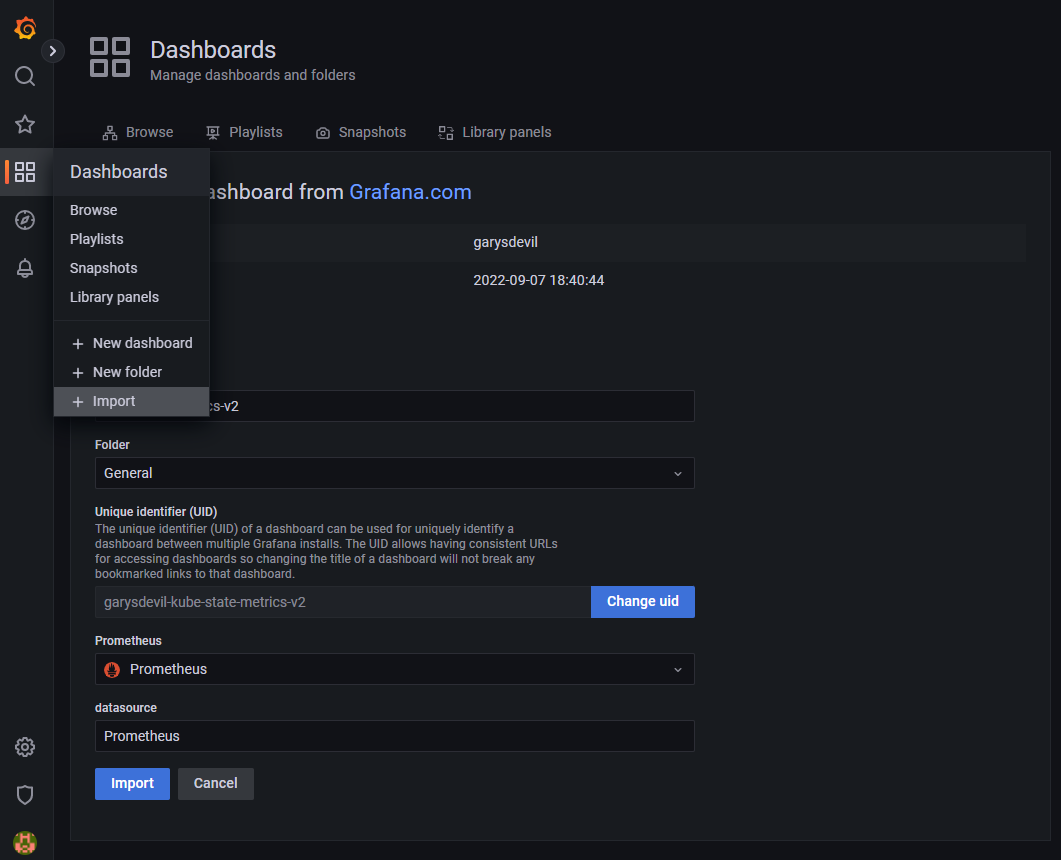
Dashboards regarding Kube state metrics and Node_exporter can be found in PUD’s repository in grafana-dashboards directory.
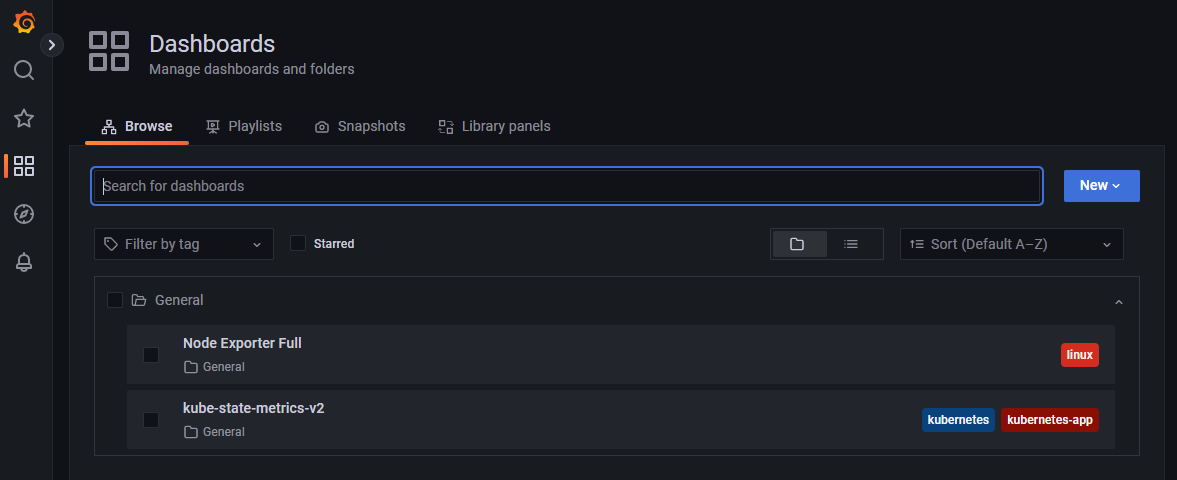
By going to Dashboards user can access and manage all of his dashboards.
1.4.3.5. Prerequisites
Kubernetes 1.16+
Helm 3+
1.4.3.6. Installation
Helm must be installed to use the charts. Please refer to Helm’s documentation to get started.
To install the chart with the release name pude :
Clone the repository to your machine.
NOTE: Change the content of extraScrapeConfigs.yaml file with the correct configurations and targets that you want PUD to scrape.
Install Performance and Usage Diagnosis Enabler
helm install pude --set-file extraScrapeConfigs=extraScrapeConfigs.yaml ./performance-and-usage-diagnosis
To check if the installation was successful run:
kubectl get pods
The result should show something like:
NAME                                                              READY   STATUS    RESTARTS   AGE
prometheus-es-adapter-85cd499bd8-dskkv                            1/1     Running   0          112s
pude-grafana-6986754ffd-7gr62                                     1/1     Running   0          112s
pude-kube-state-metrics-6f78cf594b-dg25z                          1/1     Running   0          112s
pude-performance-and-usage-diagnosis-alertmanager-cc8dfbb5ks27s   2/2     Running   0          112s
pude-performance-and-usage-diagnosis-server-76ff877d66-8z6zd      2/2     Running   0          112s
To access PUD’s Grafana Dashboard UI:
Port forward grafana’s pod to port 3000:
kubectl port-forward pude-grafana-6986754ffd-7gr62 3000
In PUD’s Grafana login page use:
Username: admin
To find the current password enter:
kubectl get secret pude-grafana -o jsonpath="{.data.admin-password}" | base64 --decode ; echo
To get kubernetes secrets and grafana’s secret name witch in our case is pude-grafana enter:
kubectl get secrets
To change your grafanas password enter:
kubectl exec -it <grafanas pod name> grafana-cli admin reset-admin-password <your reset password>
Add Prometheus data sourse PUD’s Grafana:
Go to
Settings > Add Data Source > Prometheus.
To set Prometheus’ URL under HTTP settings first find performance-and-usage-diagnosis-server clusterIP:
kubectl get services
Copy and Paste the IP in the URL field.
Save & Test
Import new Dashboards for PUD’s Grafana:
Go to
Dashboards > + Import.Upload Dashboard’s json file or choose one from grafana.com.
Load
Node_exporter Installation:
Create a node_exporter user to run the node exporter service.
sudo useradd -rs /bin/false node_exporter
Create a node_exporter service file under systemd.
sudo vi /etc/systemd/system/node_exporter.service
Add the following service file content to the service file and save it.
[Unit]
Description=Node Exporter
After=network.target

[Service]
User=node_exporter
Group=node_exporter
Type=simple
ExecStart=/usr/local/bin/node_exporter

[Install]
WantedBy=multi-user.target
Reload the system daemon and star the node exporter service.
sudo systemctl daemon-reload
sudo systemctl start node_exporter
Check the node exporter status to make sure it is running in the active state.
sudo systemctl status node_exporter
Enable the node exporter service to the system startup.
sudo systemctl enable node_exporter
Now, node exporter would be exporting metrics on port 9100.
1.4.3.7. Configuration options
The following table lists the configurable parameters of the Prometheus chart and their default values.
Parameter |
Description |
Default |
|---|---|---|
alertmanager.enabled |
If true, create alertmanager |
|
alertmanager.name |
alertmanager container name |
|
alertmanager.useClusterRole |
Use a ClusterRole (and ClusterRoleBinding). If set to false - we define a Role and RoleBinding in the defined namespaces ONLY. This makes alertmanager work - for users who do not have ClusterAdmin privs, but wants alertmanager to operate on their own namespaces, instead of clusterwide. |
|
alertmanager.useExistingRole |
Set to a rolename to use existing role - skipping role creating - but still doing serviceaccount and rolebinding to the rolename set here. |
|
alertmanager.image.repository |
alertmanager container image repository |
|
alertmanager.image.tag |
alertmanager container image tag |
|
alertmanager.image.pullPolicy |
alertmanager container image pull policy |
|
alertmanager.prefixURL |
The prefix slug at which the server can be accessed |
|
alertmanager.baseURL |
The external url at which the server can be accessed |
|
alertmanager.extraArgs |
Additional alertmanager container arguments |
|
alertmanager.extraSecretMounts |
Additional alertmanager Secret mounts |
|
alertmanager.configMapOverrideName |
Prometheus alertmanager ConfigMap override where full-name is {{.Release.Name}}-{{.Values.alertmanager.configMapOverrideName}} and setting this value will prevent the default alertmanager ConfigMap from being generated |
|
alertmanager.configFromSecret |
The name of a secret in the same kubernetes namespace which contains the Alertmanager config, setting this value will prevent the default alertmanager ConfigMap from being generated |
|
alertmanager.configFileName |
The configuration file name to be loaded to alertmanager. Must match the key within configuration loaded from ConfigMap/Secret. |
|
alertmanager.ingress.enabled |
If true, alertmanager Ingress will be created |
|
alertmanager.ingress.annotations |
alertmanager Ingress annotations |
|
alertmanager.ingress.extraLabels |
alertmanager Ingress additional labels |
|
alertmanager.ingress.hosts |
alertmanager Ingress hostnamesv |
|
alertmanager.ingress.extraPaths |
Ingress extra paths to prepend to every alertmanager host configuration. Useful when configuring custom actions with AWS ALB Ingress Controller |
|
alertmanager.ingress.tls |
alertmanager Ingress TLS configuration (YAML) |
|
alertmanager.nodeSelector |
node labels for alertmanager pod assignment |
|
alertmanager.tolerations |
node taints to tolerate (requires Kubernetes >=1.6) |
|
alertmanager.affinity |
pod affinity |
|
alertmanager.podDisruptionBudget.enabled |
If true, create a PodDisruptionBudget |
|
alertmanager.podDisruptionBudget.maxUnavailable |
Maximum unavailable instances in PDB |
|
alertmanager.schedulerName |
alertmanager alternate scheduler name |
|
alertmanager.persistentVolume.enabled |
If true, alertmanager will create a Persistent Volume Claim |
|
alertmanager.persistentVolume.accessModes |
alertmanager data Persistent Volume access modes |
|
alertmanager.persistentVolume.annotations |
Annotations for alertmanager Persistent Volume Claim |
|
alertmanager.persistentVolume.existingClaim |
alertmanager data Persistent Volume existing claim name |
|
alertmanager.persistentVolume.mountPath |
alertmanager data Persistent Volume mount root path |
|
alertmanager.persistentVolume.size |
alertmanager data Persistent Volume size |
|
alertmanager.persistentVolume.storageClass |
alertmanager data Persistent Volume Storage Class |
|
alertmanager.persistentVolume.volumeBindingMode |
alertmanager data Persistent Volume Binding Mode |
|
alertmanager.persistentVolume.subPath |
Subdirectory of alertmanager data Persistent Volume to mount |
|
alertmanager.podAnnotations |
annotations to be added to alertmanager pods |
|
alertmanager.podLabels |
labels to be added to Prometheus AlertManager pods |
|
alertmanager.podSecurityPolicy.annotations |
Specify pod annotations in the pod security policy |
|
alertmanager.replicaCount |
desired number of alertmanager pods |
|
alertmanager.statefulSet.enabled |
If true, use a statefulset instead of a deployment for pod management |
|
alertmanager.statefulSet.podManagementPolicy |
podManagementPolicy of alertmanager pods |
|
alertmanager.statefulSet.headless.annotations |
annotations for alertmanager headless service |
|
alertmanager.statefulSet.headless.labels |
labels for alertmanager headless service |
|
alertmanager.statefulSet.headless.enableMeshPeer |
If true, enable the mesh peer endpoint for the headless service |
|
alertmanager.statefulSet.headless.servicePort |
alertmanager headless service port |
|
alertmanager.priorityClassName |
alertmanager priorityClassName |
|
alertmanager.resources |
alertmanager pod resource requests & limits |
|
alertmanager.securityContext |
Custom security context for Alert Manager containers |
|
alertmanager.service.annotations |
annotations for alertmanager service |
|
alertmanager.service.clusterIP |
internal alertmanager cluster service IP |
|
alertmanager.service.externalIPs |
alertmanager service external IP addresses |
|
alertmanager.service.loadBalancerIP |
IP address to assign to load balancer (if supported) |
|
alertmanager.service.loadBalancerSourceRanges |
list of IP CIDRs allowed access to load balancer (if supported) |
|
alertmanager.service.servicePort |
alertmanager service port |
|
alertmanager.service.sessionAffinity |
Session Affinity for alertmanager service, can be None or ClientIP |
|
alertmanager.service.type |
type of alertmanager service to create |
|
alertmanager.strategy |
Deployment strategy |
|
alertmanagerFiles.alertmanager.yml |
Prometheus alertmanager configuration |
|
configmapReload.prometheus.enabled |
If false, the configmap-reload container for Prometheus will not be deployed |
|
configmapReload.prometheus.name |
configmap-reload container name |
|
configmapReload.prometheus.image.repository |
configmap-reload container image repository |
|
configmapReload.prometheus.image.tag |
configmap-reload container image tag |
|
configmapReload.prometheus.image.pullPolicy |
configmap-reload container image pull policy |
|
configmapReload.prometheus.extraArgs |
Additional configmap-reload container arguments |
|
configmapReload.prometheus.extraVolumeDirs |
Additional configmap-reload volume directories |
|
configmapReload.prometheus.extraConfigmapMounts |
Additional configmap-reload configMap mounts |
|
configmapReload.prometheus.resources |
configmap-reload pod resource requests & limits |
|
configmapReload.alertmanager.enabled |
If false, the configmap-reload container for AlertManager will not be deployed |
|
configmapReload.alertmanager.name |
configmap-reload container name |
|
configmapReload.alertmanager.image.repository |
configmap-reload container image repository |
|
configmapReload.alertmanager.image.repository |
configmap-reload container image repository |
|
configmapReload.alertmanager.image.tag |
configmap-reload container image tag |
|
configmapReload.alertmanager.image.pullPolicy |
configmap-reload container image pull policy |
|
configmapReload.alertmanager.extraArgs |
Additional configmap-reload container arguments |
|
configmapReload.alertmanager.extraVolumeDirs |
Additional configmap-reload volume directories |
|
configmapReload.alertmanager.extraConfigmapMounts |
Additional configmap-reload configMap mounts |
|
configmapReload.alertmanager.resources |
configmap-reload pod resource requests & limits |
|
initChownData.enabled |
If false, don’t reset data ownership at startup |
|
initChownData.name |
init-chown-data container name |
|
initChownData.image.repository |
init-chown-data container image repository |
|
initChownData.image.tag |
init-chown-data container image tag |
|
initChownData.image.pullPolicy |
init-chown-data container image pull policy |
|
initChownData.resources |
init-chown-data pod resource requests & limits |
|
kubeStateMetrics.enabled |
If true, create kube-state-metrics sub-chart |
|
kube-state-metrics |
kube-state-metrics configuration options |
|
rbac.create |
If true, create & use RBAC resources |
|
server.enabled |
If false, Prometheus server will not be created |
|
server.name |
Prometheus server container name |
|
server.image.repository |
Prometheus server container image repository |
|
server.image.tag |
Prometheus server container image tag |
|
server.image.pullPolicy |
Prometheus server container image pull policy |
|
server.configPath |
Path to a prometheus server config file on the container FS |
|
server.global.scrape_interval |
How frequently to scrape targets by default |
|
server.global.scrape_timeout |
How long until a scrape request times out |
|
server.global.evaluation_interval |
How frequently to evaluate rules |
|
server.remoteWrite |
The remote write feature of Prometheus allow transparently sending samples. |
|
server.remoteRead |
The remote read feature of Prometheus allow transparently receiving samples. |
|
server.extraArgs |
Additional Prometheus server container arguments |
|
server.extraFlags |
Additional Prometheus server container flags |
|
server.extraInitContainers |
Init containers to launch alongside the server |
|
server.prefixURL |
The prefix slug at which the server can be accessed |
|
server.baseURL |
The external url at which the server can be accessed |
|
server.env |
Prometheus server environment variables |
|
server.extraHostPathMounts |
Additional Prometheus server hostPath mounts |
|
server.extraConfigmapMounts |
Additional Prometheus server configMap mounts |
|
server.extraSecretMounts |
Additional Prometheus server Secret mounts |
|
server.extraVolumeMounts |
Additional Prometheus server Volume mounts |
|
server.extraVolumes |
Additional Prometheus server Volumes |
|
server.configMapOverrideName |
Prometheus server ConfigMap override where full-name is {{.Release.Name}}-{{.Values.server.configMapOverrideName}} and setting this value will prevent the default server ConfigMap from being generated |
|
server.ingress.enabled |
If true, Prometheus server Ingress will be created |
|
server.ingress.annotations |
Prometheus server Ingress annotations |
|
server.ingress.extraLabels |
Prometheus server Ingress additional labels |
|
server.ingress.hosts |
Prometheus server Ingress hostnames |
|
server.ingress.extraPaths |
Ingress extra paths to prepend to every Prometheus server host configuration. Useful when configuring custom actions with AWS ALB Ingress Controller |
|
server.ingress.tls |
Prometheus server Ingress TLS configuration (YAML) |
|
server.nodeSelector |
node labels for Prometheus server pod assignment |
|
server.tolerations |
node taints to tolerate (requires Kubernetes >=1.6) |
|
server.affinity |
pod affinity |
|
server.podDisruptionBudget.enabled |
If true, create a PodDisruptionBudget |
|
server.podDisruptionBudget.maxUnavailable |
Maximum unavailable instances in PDB |
|
server.priorityClassName |
Prometheus server priorityClassName |
|
server.enableServiceLinks |
Set service environment variables in Prometheus server pods |
|
server.schedulerName |
Prometheus server alternate scheduler name |
|
server.persistentVolume.enabled |
If true, Prometheus server will create a Persistent Volume Claim |
|
server.persistentVolume.accessModes |
Prometheus server data Persistent Volume access modes |
|
server.persistentVolume.annotations |
Prometheus server data Persistent Volume annotations |
|
server.persistentVolume.existingClaim |
Prometheus server data Persistent Volume existing claim name |
|
server.persistentVolume.mountPath |
Prometheus server data Persistent Volume mount root path |
|
server.persistentVolume.size |
Prometheus server data Persistent Volume size |
|
server.persistentVolume.storageClass |
Prometheus server data Persistent Volume Storage Class |
|
server.persistentVolume.volumeBindingMode |
Prometheus server data Persistent Volume Binding Mode |
|
server.persistentVolume.subPath |
Subdirectory of Prometheus server data Persistent Volume to mount |
|
server.emptyDir.sizeLimit |
emptyDir sizeLimit if a Persistent Volume is not used |
|
server.podAnnotations |
annotations to be added to Prometheus server pods |
|
server.podLabels |
labels to be added to Prometheus server pods |
|
server.alertmanagers |
Prometheus AlertManager configuration for the Prometheus server |
|
server.deploymentAnnotations |
annotations to be added to Prometheus server deployment |
|
server.podSecurityPolicy.annotations |
Specify pod annotations in the pod security policy |
|
server.replicaCount |
desired number of Prometheus server pods |
|
server.statefulSet.enabled |
If true, use a statefulset instead of a deployment for pod management |
|
server.statefulSet.annotations |
annotations to be added to Prometheus server stateful set |
|
server.statefulSet.labels |
labels to be added to Prometheus server stateful set |
|
server.statefulSet.podManagementPolicy |
podManagementPolicy of server pods |
|
server.statefulSet.headless.annotations |
annotations for Prometheus server headless service |
|
server.statefulSet.headless.labels |
labels for Prometheus server headless service |
|
server.statefulSet.headless.servicePort |
Prometheus server headless service port |
|
server.statefulSet.headless.gRPC.enabled |
If true, open a second port on the service for gRPC |
|
server.statefulSet.headless.gRPC.servicePort |
Prometheus service gRPC port, (ignored if server.service.gRPC.enabled is not true) |
|
server.statefulSet.headless.gRPC.nodePort |
Port to be used as gRPC nodePort in the prometheus service |
|
server.readinessProbeInitialDelay |
the initial delay for the Prometheus server readiness probe |
|
server.readinessProbePeriodSeconds |
how often (in seconds) to perform the Prometheus server readiness probe |
|
server.readinessProbeTimeout |
the timeout for the Prometheus server readiness probe |
|
server.readinessProbeFailureThreshold |
the failure threshold for the Prometheus server readiness probe |
|
server.readinessProbeSuccessThreshold |
the success threshold for the Prometheus server readiness probe |
|
server.livenessProbeInitialDelay |
the initial delay for the Prometheus server liveness probe |
|
server.livenessProbePeriodSeconds |
how often (in seconds) to perform the Prometheus server liveness probe |
|
server.livenessProbeTimeout |
the timeout for the Prometheus server liveness probe |
|
server.livenessProbeFailureThreshold |
the failure threshold for the Prometheus server liveness probe |
|
server.livenessProbeSuccessThreshold |
the success threshold for the Prometheus server liveness probe |
|
server.resources |
Prometheus server resource requests and limits |
|
server.verticalAutoscaler.enabled |
If true a VPA object will be created for the controller (either StatefulSet or Deployemnt, based on above configs) |
|
server.securityContext |
Custom security context for server containers |
|
server.service.annotations |
annotations for Prometheus server service |
|
server.service.clusterIP |
internal Prometheus server cluster service IP |
|
server.service.externalIPs |
Prometheus server service external IP addresses |
|
server.service.loadBalancerIP |
IP address to assign to load balancer (if supported) |
|
server.service.loadBalancerSourceRanges |
list of IP CIDRs allowed access to load balancer (if supported) |
|
server.service.nodePort |
Port to be used as the service NodePort (ignored if server.service.type is not NodePort) |
|
server.service.servicePort |
Prometheus server service port |
|
server.service.sessionAffinity |
Session Affinity for server service, can be None or ClientIP |
|
server.service.type |
type of Prometheus server service to create |
|
server.service.gRPC.enabled |
If true, open a second port on the service for gRPC |
|
server.service.gRPC.servicePort |
Prometheus service gRPC port, (ignored if server.service.gRPC.enabled is not true) |
|
server.service.gRPC.nodePort |
Port to be used as gRPC nodePort in the prometheus service |
|
server.service.statefulsetReplica.enabled |
If true, send the traffic from the service to only one replica of the replicaset |
|
server.service.statefulsetReplica.replica |
Which replica to send the traffice to |
|
server.hostAliases |
/etc/hosts-entries in container(s) |
|
server.sidecarContainers |
array of snippets with your sidecar containers for prometheus server |
|
server.strategy |
Deployment strategy |
|
serviceAccounts.alertmanager.create |
If true, create the alertmanager service account |
|
serviceAccounts.alertmanager.name |
name of the alertmanager service account to use or create |
|
serviceAccounts.alertmanager.annotations |
annotations for the alertmanager service account |
|
serviceAccounts.server.create |
If true, create the server service account |
|
serviceAccounts.server.name |
name of the server service account to use or create |
|
serviceAccounts.server.annotations |
annotations for the server service account |
|
server.terminationGracePeriodSeconds |
Prometheus server Pod termination grace period |
|
server.retention |
(optional) Prometheus data retention |
|
serverFiles.alerting_rules.yml |
Prometheus server alerts configuration |
|
serverFiles.recording_rules.yml |
Prometheus server rules configuration |
|
serverFiles.prometheus.yml |
Prometheus server scrape configuration |
|
extraScrapeConfigs |
Prometheus server additional scrape configuration |
|
alertRelabelConfigs |
Prometheus server alert relabeling configs for H/A prometheus |
|
networkPolicy.enabled |
Enable NetworkPolicy |
|
forceNamespace |
Force resources to be namespaced |
|
Specify each parameter using the --set key=value[,key=value] argument to helm install. For example:
helm install PUD/prometheus --name my-release --set server.terminationGracePeriodSeconds=360
Alternatively, a YAML file that specifies the values for the above parameters can be provided while installing the chart. For example:
helm install PUD/prometheus --name my-release -f values.yaml
The following table lists the configurable parameters of the Prometheus-elasticsearch-adapter chart and their default values.
Env Variables |
Description |
Default |
|---|---|---|
ES_URL |
Elasticsearch URL |
|
ES_USER |
Elasticsearch User |
|
ES_PASSWORD |
Elasticsearch User Password |
|
ES_WORKERS |
Number of batch workers |
|
ES_BATCH_MAX_AGE |
Max period in seconds between bulk Elasticsearch insert operations |
|
ES_BATCH_MAX_DOCS |
Max items for bulk Elasticsearch insert operation |
|
ES_BATCH_MAX_SIZE |
Max size in bytes for bulk Elasticsearch insert operation |
|
ES_ALIAS |
Elasticsearch alias pointing to active write index |
|
ES_INDEX_DAILY |
Create daily indexes and disable index rollover |
|
ES_INDEX_SHARDS |
Number of Elasticsearch shards to create per index |
|
ES_INDEX_REPLICAS |
Number of Elasticsearch replicas to create per index |
|
ES_INDEX_MAX_AGE |
Max age of Elasticsearch index before rollover |
|
ES_INDEX_MAX_DOCS |
Max number of docs in Elasticsearch index before rollover |
|
ES_INDEX_MAX_SIZE |
Max size of index before rollover eg 5gb |
|
ES_SEARCH_MAX_DOCS |
Max number of docs returned for Elasticsearch search operation |
|
ES_SNIFF |
Enable Elasticsearch sniffing |
|
STATS |
Expose Prometheus metrics endpoint |
|
DEBUG |
Display extra debug logs |
|
1.4.3.8. Developer guide
1.4.3.8.1. PUD’s Prometheus Metrics & Exporters
Performance and Usage Diagnosis (PUD) Enabler follows an HTTP pull model: It scrapes performance metrics from endpoints routinely. Typically the abstraction layer between the application and PUD is an exporter, which takes application-formatted metrics and converts them to Prometheus metrics for consumption. Because PUD uses an HTTP pull model, the exporter typically provides an endpoint /metrics where the performance metrics can be scraped.
The relationship between Prometheus, the exporter, and the application in a Kubernetes environment can be visualized like this:
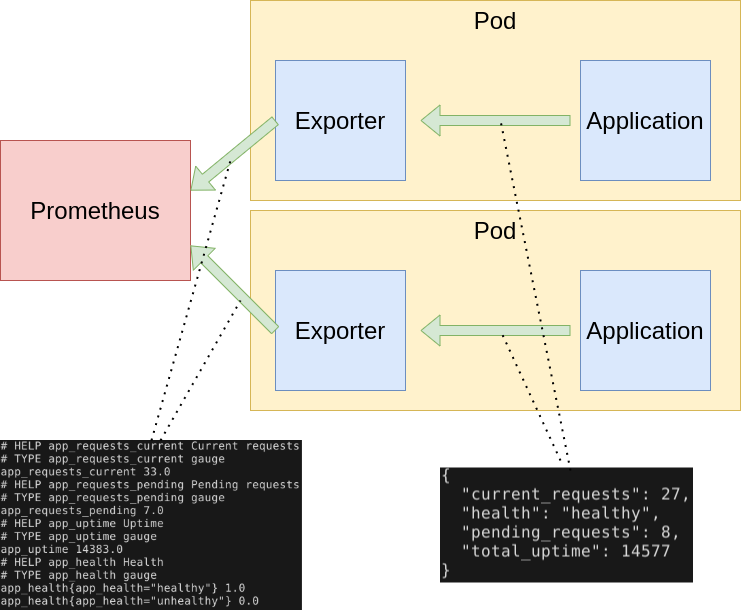
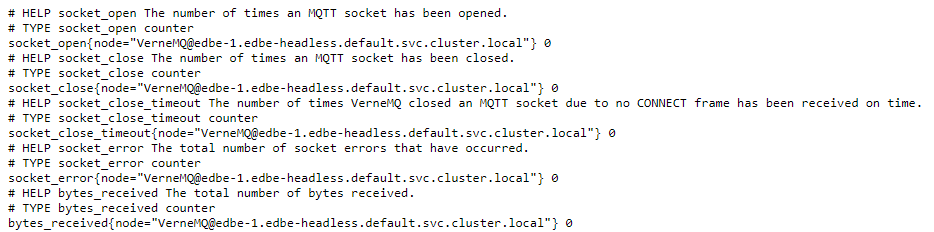
Metrics are served as plaintext. They are designed to be consumed either by PUD itself or by a scraper that is compatible with scraping a Prometheus client endpoint. The raw metrics can also be visualized in a browser by opening /metrics endpoint. Note that the metrics exposed on the /metrics endpoint reflect the current state of the application monitored.
The Prometheus metrics format is so widely adopted that it became an independent project: OpenMetrics, striving to make this metric format specification an industry standard.
1.4.3.8.2. Prometheus metrics naming
Generally metric names should allow someone who is familiar with Prometheus but not a particular system to make a good guess as to what a metric means. A metric named http_requests_total is not extremely useful - are these being measured as they come in, in some filter or when they get to the user’s code? And requests_total is even worse, what type of requests?
Metric names for applications should generally be prefixed by the exporter name, e.g. haproxy_up.
Metrics must use base units (e.g. seconds, bytes) and leave converting them to something more readable to graphing tools. No matter what units you end up using, the units in the metric name must match the units in use.
Prometheus metrics and label names are written in snake_case. Only [a-zA-Z0-9:_] are valid in metric names.
The _sum, _count, _bucket and _total suffixes are used by Summaries, Histograms and Counters. Unless you’re producing one of those, avoid these suffixes. _total is a convention for counters, you should use it if you’re using the COUNTER type. Prometheus metric format has a name combined with a series of labels or tags.
<metric name>{<label name>=<label value>, ...}
A time series with the metric name http_requests_total and the labels service=”service”, server=”pod50” and env=”production” could be written like this:
http_requests_total{service="service", server="pod50", env="production"}
You can associate any number of context-specific labels to every metric you submit. Imagine a typical metric like http_requests_per_second, every one of your web servers is emitting these metrics. You can then bundle the labels (or dimensions): - Web Server software (Nginx, Apache) - Environment (production, staging) - HTTP method (POST, GET) - Error code (404, 503) - HTTP response code (number) - Endpoint (/webapp1, /webapp2) - Datacenter zone (east, west)
Prometheus metrics text-based format is line oriented. Lines are separated by a line feed character (n). The last line must end with a line feed character. Empty lines are ignored. A metric is composed by several fields: - Metric name - Any number of labels (can be 0), represented as a key-value array - Current metric value - Optional metric timestamp
A Prometheus metric can be as simple as:
http_requests 2
Or, including all the mentioned components:
http_requests_total{method="post",code="400"} 3 1395066363000
Metric output is typically preceded with # HELP and # TYPE metadata lines.
The HELP string identifies the metric name and a brief description of it. The TYPE string identifies the type of metric. If there’s no TYPE before a metric, the metric is set to untyped. Everything else that starts with a # is parsed as a comment.
# HELP metric_name Description of the metric
# TYPE metric_name type
# Comment that's not parsed by prometheus
http_requests_total{method="post",code="400"}  3   1395066363000
1.4.3.8.3. Prometheus metrics client libraries
The Prometheus project maintains 4 official Prometheus metrics libraries written in Go, Java / Scala, Python, and Ruby. The Prometheus community has created many third-party libraries that you can use to instrument other languages (or just alternative implementations for the same language):
Bash
C++
Common Lisp
Elixir
Erlang
Haskell
Lua for Nginx
Lua for Tarantool
.NET / C#
Node.js
Perl
PHP
Rust
1.4.3.8.4. Prometheus metrics / OpenMetrics types
Depending on what kind of information you want to collect and expose, you’ll have to use a different metric type. Here are your four choices available on the OpenMetrics specification:
Counter
This represents a cumulative metric that only increases over time, like the number of requests to an endpoint. Note: instead of using Counter to instrument decreasing values, use Gauges.
# HELP go_memstats_alloc_bytes_total Total number of bytes allocated, even if freed.
# TYPE go_memstats_alloc_bytes_total counter
go_memstats_alloc_bytes_total 3.7156890216e+10
Gauge
Gauges are instantaneous measurements of a value. They can be arbitrary values which will be recorded. Gauges represent a random value that can increase and decrease randomly such as the load of your system.
# HELP go_goroutines Number of goroutines that currently exist.
# TYPE go_goroutines gauge
go_goroutines 73
Histogram
A histogram samples observations (usually things like request durations or response sizes) and counts them in configurable buckets. It also provides a sum of all observed values. A histogram with a base metric name of exposes multiple time series during a scrape:
# HELP http_request_duration_seconds request duration histogram
# TYPE http_request_duration_seconds histogram
http_request_duration_seconds_bucket{le="0.5"} 0
http_request_duration_seconds_bucket{le="1"} 1
http_request_duration_seconds_bucket{le="2"} 2
http_request_duration_seconds_bucket{le="3"} 3
http_request_duration_seconds_bucket{le="5"} 3
http_request_duration_seconds_bucket{le="+Inf"} 3
http_request_duration_seconds_sum 6
http_request_duration_seconds_count 3
Summary
Similar to a histogram, a summary samples observations (usually things like request durations and response sizes). While it also provides a total count of observations and a sum of all observed values, it calculates configurable quantiles over a sliding time window. A summary with a base metric name of also exposes multiple time series during a scrape:
More regarding OpenMetrics types
1.4.3.8.5. Prometheus exporters
Many popular server applications like Nginx or PostgreSQL are much older than the Prometheus metrics / OpenMetrics popularization. They usually have their own metrics formats and exposition methods. To work around this hurdle, the Prometheus community is creating and maintaining a vast collection of Prometheus exporters. An exporter is a “translator” or “adapter” program able to collect the server native metrics and re-publishing these metrics using the Prometheus metrics format and HTTP protocol transports. These small binaries can be co-located in the same container or pod executing the main server that is being monitored, or isolated in their own sidecar container and then you can collect the service metrics scraping the exporter that exposes and transforms them into Prometheus metrics.
There are a number of exporters that are maintained as part of the official Prometheus GitHub.
You might need to write your own exporter if…
You’re using 3rd party software that doesn’t have an existing exporter already
You want to generate Prometheus metrics from software that you have written
1.4.3.8.6. Example
Building a generic HTTP server metrics exporter in Python. By Nancy Chauhan: https://levelup.gitconnected.com/building-a-prometheus-exporter-8a4bbc3825f5
1.4.3.9. Version control and release
Prometheus v2.31.1
Prometheus-es-adapter v3.3
Grafana v9.1.1
kube-state-metrics v2.8.1
node_exporter v0.18.1
1.4.3.10. License
Apache License 2.0